
Be in the Know: 2018 Holiday Marketing Statistics You Should Know
by Cydney Hatch


Are you ready for the holiday season? Yes, I know fall has barely just begun, but it’s never too early for retailers and e-tailers to start thinking about holiday marketing and sales. It’s a good time to be in retail, especially with shopping extravaganzas like Black Friday and Cyber Monday just around the corner.
At the moment, it is projected that U.S. shoppers will spend $119.99 billion with online retailers during the upcoming holiday shopping season of Nov. 1-Dec. 31. That’s a 15.5% increase compared with the estimated $103.88 billion spent online during the same period in 2017.

Talk about sleighing ALL THE WAY…
However, to really capitalize on the potential of the upcoming holiday season, retailers must know how mobile will dominate the shopper experience, the importance of social media brand awareness and how artificial intelligence-powered, personalized product recommendations will factor into holiday purchasing in order to successfully reach their full potential during the 2018 holiday shopping season.
To help you make the most of this holiday season, let’s take a look at a compiled list of some of the most important holiday marketing statistics you need to know in 2018 so you can plan accordingly. With this information, you can take a look into 2o18 holiday marketing trends and use them to shape up your holiday marketing for a jolly good time!
2018: Holiday Marketing Statistics to Consider
*Helpful numbers to put these statistics in perspective: The world population is 7.7 billion and the internet has 4.1 billion users.
General Holiday Shopping Statistics
- Holiday shopping starts as early as September and October.
- Consumer confidence in the US is at its highest level since 2000, according to some measures. With low unemployment and rising wages, the immediate outlook for consumer spending remains solid.
- The US Department of Commerce found sales of building materials and garden equipment surged by 8.1% during the holiday season, while furniture and home furnishing sales increased by 7.5% and sales in electronics and appliance stores grew 6.7%.
- Despite the merry holiday season for retailers, foot traffic continues to slump. One study found foot traffic in US retail stores fell 7.5% in November and December 2017, continuing the longer-term trend toward ecommerce and away from traditional retail.
- NRF expects holiday retail sales in November and December—excluding automobiles, gasoline and restaurants—will increase between 4.3% and 4.8% over 2017 for a total of $717.45 billion to $720.89 billion. The forecast compares with an average annual increase of 3.9% over the past five years.
- For the second consecutive year, Black Friday was the biggest digital shopping day of the season, with revenue growing 32% year-over-year, more than doubling Cyber Monday’s 15% increase.
- Cyber Week II is the best-hidden opportunity. Gift cards in hand, customers are ready to treat themselves in the run-up to New Year’s Day.
- Last year, Shopper Story 2017 found that, in most countries, shoppers value both online and retail experiences. In fact, 62% of shoppers said that they use their phones while they’re in-store.
- According to an Adobe Digital Insights report, Black Friday represents 4.6% of total U.S. retail revenue for the holiday season.
- Cyber Monday represented 6.1 % of total holiday retail sales.
- It is predicted that more than half of holiday orders will include free shipping.
- Black Friday peaks at 8:00 PM.
- The average shopper will purchase 14 gifts during the 2016 holiday season.
- One-third of shoppers report holiday weekend purchases were driven by promotions.
- Last minute shoppers make up nearly 30% of online holiday sales!
- USPS expected to deliver more than 15 billion pieces of mail including 850 million packages.
- UPS planned to deliver more than 750 million packages globally.
- FedEx predicted 400 million packages.
Mobile and Online Holiday Shopping Statistics
- Last year, Cyber Monday alone drove $2 billion dollars in one day through mobile!
- In 2017, more than 40% of all online sales in November and December were made on mobile phones. This year, get ready for more than half of all online holiday purchases to occur on mobile.
- 8 in 10 holiday shoppers are influenced by the internet before making a purchase (with search engines being the most influential).
- December’s highest traffic day (on mobile at least)—is actually the day after Christmas
- Mobile continues to be a driving force for ecommerce growth. US retail “mcommerce” sales were up more than 40% in Q4 2017, according to comScore Inc. eMarketer expects total US retail mcommerce sales will grow a further 32.7% in 2018.
- Online sales accounted for 13.0% of total retail sales last year. And, in the first quarter of 2018, ecommerce accounted for 13.8% of total retail sales, a 1.4 percentage point increase from a year earlier, according to Internet Retailer estimates.
- Thanksgiving 2017 marked the first time that computer order share dropped below 50%. On Christmas Day, mobile order share rose to 50%, marking the first time ever that mobile devices accounted for the majority of all purchases made.
- Research from Winterberry Group found that only 1.3% of marketers are “extremely confident” in their data strategies, with analytics being the most desired addition for most teams.
- December 23, 2017, (closely followed by Christmas Eve and Christmas) was the biggest day ever in the history of mobile commerce in the US: 48% of all purchases were made on smartphones.
- 68% of shoppers visit YouTube on their smartphones to determine what to buy.
- Voice search shopping will be 3% of holiday sales as 46% of Americans use voice devices like Alexa.
- 8.8 billion data points were collected during Black Friday last year in the form of email signups and a host of other lead-generation tactics, roughly 3 billion emails were sent.
- Conversions fall by up to 20% for every second delay of mobile page load time.
- 83 percent of 18-44 year-old users will use their mobile phone inside a retail store—note by 2019, 33% of human population will be 18 years-old or younger
- In 2018, the traffic originated from smartphones will be greater than all of the traffic in 2015 across all device types—PCs, tablets, laptops and phones
- For the first time, traffic from social networks will exceed 5% of all traffic. Instagram is up 51% from 2017 in terms of retail shopping traffic.
- 76% of mobile shoppers change their mind about which retailer/brand to buy from after searching online.
- 55% of shoppers around the world have a more favorable view of businesses that respond to them over social media
- Over $20 Billion worth of goods purchased between November and December will be returned.
- The average holiday shopper spends around $935 online during the holidays.
Ecommerce Holiday Shopping Statistics
- Deloitte estimates that ecommerce sales could increase between 17-22% for the 2018 holiday season, which it defines as Nov. 1-Jan. 31.
- Amazon alone accounted for 37.5% of total U.S. e-retail sales during the 2017 holiday season.
- Holiday ecommerce sales are expected to increase 15.3% in 2018, says eMarketer’s new forecast. And while that sounds great (and it is), in 2017, holiday e-commerce sales grew 17.8%—an increase that the National Retail Federation (NRF) attributed to “growing wages, stronger employment and higher confidence.”
- According to research by LCP Consulting, the return rate for Black Friday purchases is 50% higher than the rate across the year as a whole.
- 64% of smartphone shoppers turn to mobile search before heading to the store.
- Bid prices can increase by 140% over their yearly average during the holidays!
- 20% of marketing professionals plan more than 3 months in advance of the peak email season.
- According to BigCommerce & Live Chat Inc, on average websites recieve 63% more website visits during the holiday!
- The Economist measured that 47% of customers want fast replies to their questions, issues, and feedback.
Now You Know!
Holiday statistics offer important insights you can use to guide your holiday marketing plans. We have the numbers to track everything we wish to manipulate and highlight in our marketing actions.
Use them and you can improve any business plan! As a marketer, you can’t help but be excited for holiday palooza 2018. Clearly, there are many opportunities for rapid growth!

But, as Stanley Marcus once said, “consumers are statistics, customers are people.” That is how you should use these numbers: to better serve and help your potential customers.
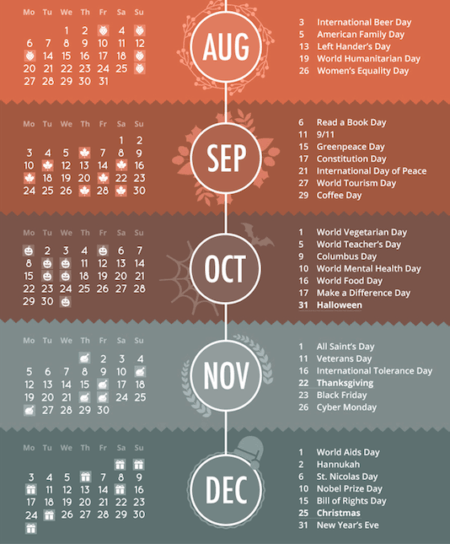
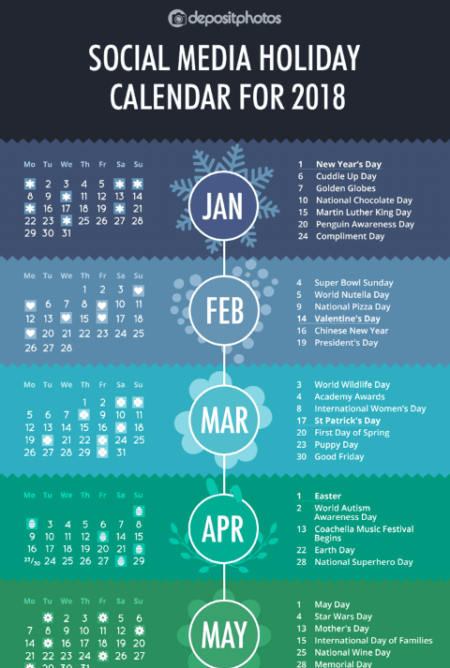
As an additional resource, I wanted to share Louise Lyer’s holiday calendar infographic to give you additional insights into holiday marketing you can take advantage of.
If you want help in creating strategies around some of these statistics, we can definitely help you make a plan! Contact me here!
What holiday statistics stood out to you? How do these holiday statistics change your marketing plans? Share your thoughts with me below!


