
What is ROAS? How to Calculate Return on Ad Spend
by Aden Andrus


If ROI is a metric that gets your engine revving, wait till you learn about ROAS!
Return on ad spend (ROAS) is a type of return on investment (ROI) that serves as an essential indicator of the success of your marketing and advertising expenses. In the simplest terms, it tells you the payout on your ad investment. If you have an interest in the bottom line, you’re gonna want to keep a sharp eye on your ROAS.
But ROAS can be a little complicated to calculate, especially if you’re using different platforms and running several campaigns. That is why getting granular is okay–you can really drill down on where your money is best spent. It may seem like a chore to keep track of it all, but most advertising platforms have automatic conversion/goal tracking built in, so figuring out which channels and platforms work best shouldn’t be too difficult.
This article will explain why ROAS is important and show you how to calculate it accurately. You’ll also learn what your goals should be with advertising and marketing expenditures. Ready? Let’s do this…
What Is ROAS?
Return on ad spend (ROAS) is a measure of dollars made for every dollar spent on advertising. Simply put, it’s the return on advertising expenditures.
As mentioned before, it’s essentially an ROI, and in many ways, also a key performance indicator (KPI). It puts a numeric value on your marketing efforts and makes them measurable, with more ROAS meaning you’re doing something right and less ROAS meaning something needs to be changed or adjusted.
It offers flexibility to calculate the return for different kinds of marketing campaigns for various niches, regardless of the industry.
What’s The Difference Between ROI and ROAS?
ROI is definitely something you want to track–perhaps as a long-term or high-level metric. It lets you know whether you’re making money at all.
ROAS, on the other hand, gives you the ability to hyper-focus on the ROI for just your advertising. You can track it in terms of all your marketing and advertising, or get as granular as a campaign or even just an ad. After all, you’re trying to see what kinds of advertising resonates with your audience and brings in the accompanying revenue.
So getting down to the nitty-gritty is where you will be most likely to ferret out sources of success and root out campaigns that are not serving.

It’s not a bad idea to calculate ROAS on your overall spend and then break it down into your channels, campaigns, platforms and then the ads themselves. This can show you where your best profitability is coming from. You can even determine a predefined minimum ROAS so that you will know pretty quickly whether your ad efforts are paying off at all. Know before you go–am I right?
ROAS Calculation
Let’s get down to brass tacks about how to calculate ROAS. The most basic and helpful formula for ROAS calculation is:
Revenue / Cost: This formula is relatively simple. Divide the revenue by the advertisement cost — including the marketing campaign, campaign managers, affiliate commissions, campaign designers, and others. While it will tell you exactly how many dollars you made per dollar spent on a campaign, it doesn’t net in the costs related to your product or service (i.e. how much does it cost to provide the service or manufacture the product).
Here’s an example of the ROAS formula at work: suppose you spent $100 on an advertisement and generated a revenue of $200 (after all advertisement costs)…
- The ROAS formula shows that you made $2 per $1 spent on ads. Here’s the calculation: $200 / $100 = $2
This is where the rubber meets the road in terms of knowing whether your ads are profitable. Pretty exciting, right? If you made more from the ads you ran than you paid to run them, you are in the green!
Tracking ROAS
Thanks to built-in analytics on many tools and platforms, ad revenue calculation and tracking are happening at all times. This is helpful because you get the data while the campaign is running, not just at the end of it. Some campaigns may run for weeks, so you need to track the ROAS continuously and vigilantly.
Google Ads allows you to track conversions for a given campaign, specifying which ad, ad group, or keyword has generated conversions, and ultimately, revenue. In most cases, especially with ecommerce stores, this is calculated by tracking clicks and purchases. For ecommerce marketing, the relation between ad spending and revenue is pretty direct unless you literally do everything wrong.
So ROAS isn’t guaranteed, but knowing the science behind ecommerce advertising usually means you will be successful. However, for other niches, things can be a little tricky. The difference comes down to conversions and sales, so let’s talk about both.
CONVERSION TRACKING
For most businesses, especially non-ecommerce ones, conversions are how to calculate ROAS, or revenue. This usually means assigning a specific value to a conversion. For example, a subscription to a newsletter or an email sign-up can be assigned an arbitrary dollar value as a conversion even though it doesn’t generate money initially. How valuable are your leads? Now you see what I’m talking about!
For campaigns run on Google, Bing, Facebook, Instagram, or Twitter, conversions are easier to track with the help of built-in analytics. On the other hand, a company tracking conversions from phone calls or emails may have to use an independent tool to calculate conversions, such as a call-tracking platform.
Calls made directly from an ad on a mobile device are tracked via analytics, though–good thing the vast majority of online shopping happens on mobile devices!
It’s all about using the right tools for every medium, be it social media, web, phone, or email. You’ll need to track conversions on each to get a sense of the total revenue generated from different advertising and marketing channels. Once you get the hang of it, it’s not that bad…and if you have your ads managed, your agency should provide you with some awesome reports on your ROAS.
SALES TRACKING
In comparison with conversions, tracking sales is a bit easier. Most sales software — for example, Salesforce, Copper, or Zoho — integrate with advertising platforms to calculate ad revenue coming directly from the sale of goods and services.
The key here is using reliable customer relationship management (CRM) software. The best ones can even track a lead to a marketing campaign when it becomes a paying customer. This way, even non-ecommerce businesses, such as subscription model businesses, can calculate ROAS. How cool is that?!
Why Does ROAS Calculation Matter?
If you’re not paying attention to your ROAS, you might be missing opportunities for growth, or worse, wasting your money on ads that aren’t working at all. You might think that because you’re already spending money, time, and effort on ads, you can just track click-through or conversion rates to see how your ads are performing.
The thing is that click-through or conversion rates don’t always reveal what you are getting back in revenue from the money you are spending on ads. Remember that the goal is to make more revenue and that is harder to calculate on clicks that might pay off further down your sales funnel. Remember when we talked about assigning value to conversions that don’t necessarily generate immediate revenue? ^^
Companies spend thousands of dollars on online ad campaigns, but if they’re not increasing sales and revenue, all that money is being wasted. It’s one thing to spend money, it’s another to get the most value out of it, and that’s what ROAS is all about.
If you aren’t seeing the direct relationship between your ad spend and your return, even clicks and conversions can amount to vanity metrics–ones that can make you think you’re doing better than you really are. Don’t let that happen!
To understand the benefits of calculating ROAS, let’s get a little techy and see what clicks, conversions, and costs tell you about your campaigns.
WHAT DOES CLICK DATA TELL YOU?
Suppose you’re a partner in the ABC law firm. Each new customer averages $3,500 in revenue with a 50% profit margin, making a net profit of $1,750.
The data for the most successful campaigns is as follows:
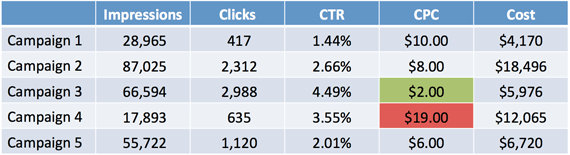
As you can see, Campaign 3 seems to be producing the best results, as it has the lowest cost per click (CPC) paired with the highest click-through rate (CTR).
But what about the end result of those clicks? Where are these clicks coming from and are they converting? It could be true that the clicks are coming from people just browsing for ‘law firms near me’ or ‘lawyer jokes’ (I mean who doesn’t love a good lawyer joke?). They may click through, but these people won’t actually hire a lawyer from your firm unless they have high conversion intent.
WHAT DOES CONVERSION DATA TELL YOU?
Now, you’re probably thinking conversion rate (CR) would be a much better measurement for ad success, at least more so than click rates. Let’s see if that’s the case and look at the conversion data below:
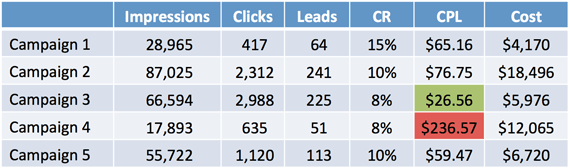
Again, Campaign 3 looks like a clear winner when considering CR. While the CR is lower than Campaigns 1, 2, and 5, the cost per lead (CPL) is the lowest. On the other hand, Campaign 4 is coming in at last as it’s costing nine times more than Campaign 3 for producing the same number of leads.
But why is Campaign 3 producing a lower CR, nearly by half, than Campaign 1? Could the ads be going to an irrelevant audience? Do you have a poor landing page or could the overall traffic be low? You see a lot of questions go unanswered even when you track conversion rate exclusively.
WHAT DOES ROAS DATA TELL YOU?
Let’s look at the ROAS now:
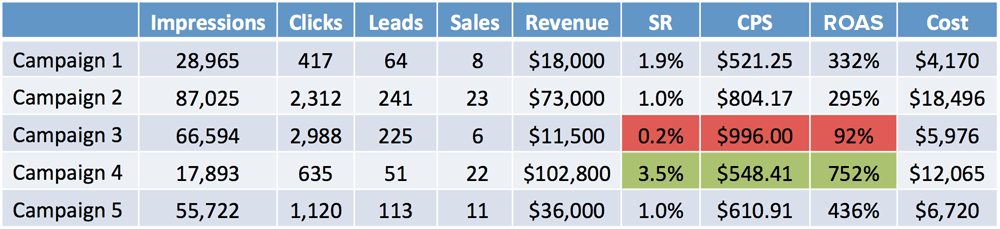
The ROAS calculation puts a new paint job on this data set! You can clearly see that Campaign 4 is making the most money for the company, despite showing weak numbers for clicks and conversions. In hindsight, Campaign 3, despite winning clicks and conversion, seems to be having the lowest ROAS and making the second-worst revenue.
But here’s the real twist: as fulfillment accounts for nearly half the revenue, Campaign 3 is actually losing money.
With a ROAS of 92%, it’s resulting in a loss for the law firm. Campaign 4, on the other hand, is making good money, profiting the company even after adjusting the costs. There could be many reasons explaining why Campaign 4 wins:
- Traffic in the lower stage of the sales funnel
- Better landing page
- Relevant searches
By now, you can see why ROAS is important. If it weren’t for this metric, you’d continue spending more on Campaign 3, resulting in even more losses.
What Is a Good ROAS?
There is a saying that you have to spend money to make money. That is true, but it doesn’t take a rocket scientist to know that you have to spend less than you make (by a pretty large margin sometimes) to make your business profitable. Let’s dive into another scenario to get a good idea of how you can determine what constitutes good ROAS for your company:
Suppose you’re a small-scale aerial tours company providing aerial tours of Bryce Canyon in Utah. One plane seats only one passenger, and the price is set at $150. Even without marketing, you’re netting 20 ticket sales per month through direct sales, referrals, and repeat customers.
Your revenue from this particular tour comes to $3,000 per month. Each flight costs $75, which means revenue, when adjusted for the cost, comes down to $1,500. Other fixed costs set you back another $2,000. Therefore, you’re losing $500 every month.
You decide to advertise. Here are what different ROAS numbers mean for your campaign:
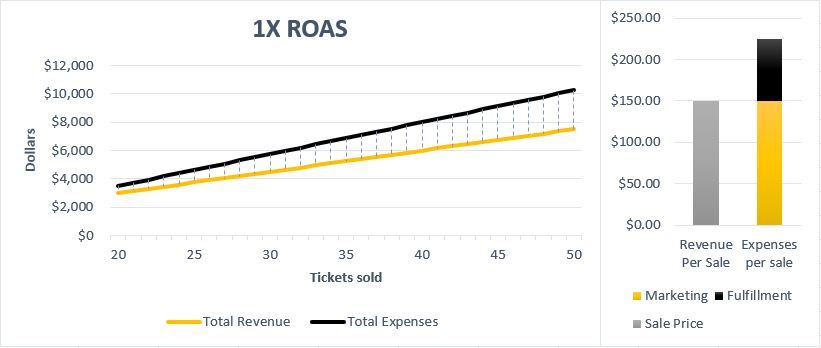
1X ROAS CALCULATION
If you made $150 after spending $150 on advertisements, you didn’t break even, at least not in this scenario. You still need to make the $500 deficit, which you only can with profit. The following chart demonstrates that. You’re still losing $75 in fulfillment costs for every sale.
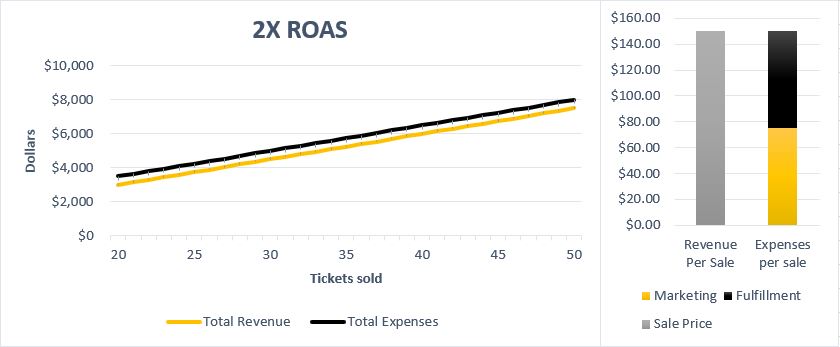
2X ROAS CALCULATION
Consider a 2:1 ratio, where you’re spending $75 and making $150. It’s an improvement but still not enough to make that glaring deficit of $500, contributed by fixed costs of the business. In scenarios where you’re in a deficit, even a slight profit from every dollar spent may not be enough.
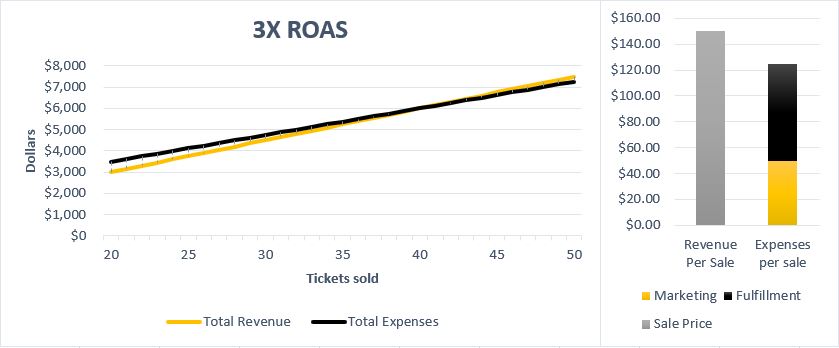
3X ROAS CALCULATION
So you spend $50 and make $150 from your advertisement per sale? Indeed, that should be a positive outcome. With a 3:1 ratio, you’ll finally break even, provided you’re getting at least 20 sales from advertising and marketing. Your advertising efforts are working, but you’ll make the deficit rather slowly. You also have to take into account logistical limitations, like the possibility of scheduling only 40 flights in a month.
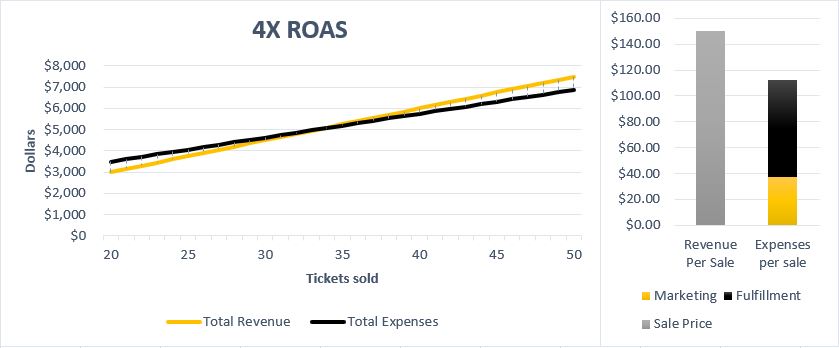
4X ROAS CALCULATION
With a 4:1 revenue to ad spending ratio, you’re nearing the target of clearing the deficit and making a profit. After 14 flights are generated from the ads, you’ll cover the costs. With a profit of $37.5 per flight, the ads will finally prove profitable.
5X ROAS CALCULATION
In the current example of the aerial tour company, a ROAS of 5:1 is ideal and puts the company in a strong position. Not only does it cover the costs, but it also nets a profit of $405 per month with 9 of the 20 sales. With these profits, your business can start to grow, like searching for a better and bigger plane and increased capacity per flight. These measures can only be taken when you’re running in profit.

The Bottom Line
Here’s what knowing how to calculate ROAS comes down to, as illustrated by the example above:
- If your ROAS is 3X or lower, you need to improve your digital marketing game, as you’re likely losing more money than gaining.
- Your target should be 5:1 ROAS, especially with the latest techniques like automated bidding, but 4:1 ROAS is also good.
- Whether ROAS is good or bad also depends on your revenue and business costs.
ROAS needs to account for all advertising expenditures to give you an accurate reflection of your success. But ROAS is downright one of the best metrics to measure the success and effectiveness of your advertising efforts and marketing strategy. The more revenue they generate after factoring in fulfillment and fixed costs, the better the outcome of running ads is.
If you need help calculating ROAS for your specific business, feel free to let us know. Do you have any questions about how ROAS works? Do you have any special tricks you use when calculating ROAS? Share in the comments!


