
by Glen Petersen • April 19, 2016


Insanely Complicated Adwords Data Made Easy
When it comes to AdWords management, data is your best friend. While your marketing instincts are great for pointing you in the right direction, it’s your cold, hard data that keeps you from running down a marketing rabbit trail.
However, as great as all that information is, often you have so much data that it can be hard to put to practical use.
Fortunately, Google has created Google Reports to help you sort through all of your data and turn it into something useful. With this tool, even the most inexperienced AdWords user can pull the kind of data reports that will allow them to make important changes to their account.
With Google Reports, reports that used to take days to assemble and analyze can be generated and assessed in minutes.
Don’t believe me? Follow along and see what kind of reports you can pull in your account today.
Getting at Your AdWords Data
Once you have logged into any AdWords account, you should be able to see the “Reports” as follows. Click the tab.

Now that you’re in the Google Reports tab, select a date range. Remember, the more data you pull, the better your analysis will be.
Typically, I start the date range with a minimum of 30 days.
Pre-Defined Reports
Now you can start by building large custom reports, but Google has already put together some general reports in the Pre-defined reports section. So, before you dive into creating a custom report, check out a few of Google’s reports.
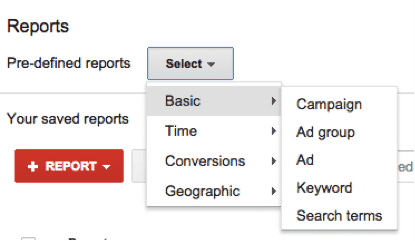
The Pre-defined reports break out items from all around conversion data, time of day that produces better for your ads, and geographical locations of your leads and using them will give a good feel for the sort of data you can get from Google Reports.
The default format of these Pre-defined reports is Table. Why? Well, Table shows the most data in a larger field area and allows you to add the widest range of metrics. As a result, Table is probably your best go-to report type.
However, if Table isn’t the right presentation form for your needs (or is just too hard to interpret), you can try a Line Chart, Bar Chart or Pie Chart instead.
However, if you select a Line, Bar or Pie Chart, you will need to be more selective with the information you add to your report, since the charts won’t be as broken out as your original Table chart.
To add metrics to your chart, just drag and drop any KPIs (Key Performance Indicators) you would like to include in your report.
Build Your Own Report
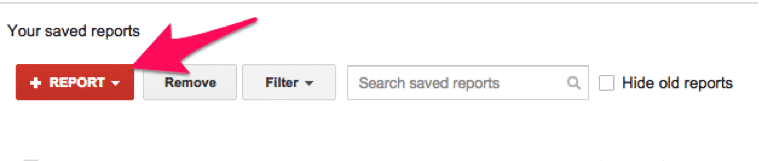
If the pre-defined reports aren’t doing the trick, you can build your own report and save it for future use by clicking on the “+Report” button. This allows you to save your table and use it for whatever date range you select.
 Now, GO CRAZY!
Personally I prefer Bar Chart graphs. I like to add in one item of focus—say Day of Week—and then I add in Clicks and Conversions to see which days produce the most conversions and/or clicks.
By the way, if you are having trouble finding a specific metric, try the Search bar for quick filtering.
Here are few custom reports that can help you quickly identify ways to improve account performance:
- Using Bar Chart, break out your CTR (Click Through Rate) and Conv. Rate (conversion rate) by Day of Week. This report will show you which days of the week are your best producers. With this information, you can up-bid, down-bid or downright eliminate days based on performance.
- For high-volume accounts, you can take the previous report and replace Day of Week with Hour of Day to see which hours are your top performers. Again, you can adjust your bidding strategy to maximize conversions.
- Finally, try replacing Hour of Day with Device. This allows you to see if mobile traffic is helping or hurting your account.
Conclusion
Your AdWords account is overflowing with data, but with Google Reports, you can actually use that data to improve your account performance.
And, instead of requiring hours or days of effort to access, you can find your data gems in a matter of minutes. Thanks, Google!
By the way, if you’d like me to take a look at your AdWords account and help you create a few helpful reports, let me know here or in the comments!
How do you use Google Reports to improve account performance? Have you discovered any data nuggets in your reports?


