
Why Google Ads Accounts Succeed and Fail [DATA]
by Aden Andrus


If you’ve ever managed a Google Ads account, at some point you’ve sat back, stared at the computer screen and wondered, “Why? Why is this happening?”
Even the most experienced account manager has this sort of moment on a regular basis. Google Ads is just plain hard to figure out.
You can follow every best practice and come up short…and then make some minor tweak that produces phenomenal results.

A while back, we realized that a lot of the apparent “randomness” of Google Ads management came from the fact that we were relying on personal experience to figure out our best practices. That didn’t work.
After trying to figure out why one person’s “best practices” backfired for someone else, it occurred to me what our problem was—we couldn’t see the forest for the trees.
To solve this problem, we started accumulating data. We collected data on our own accounts. We audited over 2,000 Google Ads accounts for potential clients.
And, amongst all that data, we made some remarkable discoveries.
Over the years since we first published these findings (March 1, 2016), we’ve audited thousands of new accounts. To be honest, very little has changed. Most accounts still struggle with these same problems and the findings in this article remain as useful today as they were when they were first published.
Warning—there’s a lot of data up ahead. If that’s not your thing, check out this less math-heavy summary.
A Quick Note About Currency
Before we dive into the details, it’s important to note that all currency has been standardized to the US dollar.This is important.
Google Ads reports monetary figures in the currency of the account, which is why many agencies report that they manage 100-500 million in annual revenue.
However, these sorts of figures typically do not take into account exchange rates.
For example, one of our clients spent 5 million on Google Ads in 2015…5 million Indian Rupees (₹). An Indian Rupee is worth $0.015, so the client really only spent $76,000.

As you might imagine, giving an ₹ 18 cost-per-click (CPC) the same weight as an $18 CPC would severely skew our results, which is why we standardize everything to USD.
What Did We Learn from 2,000+ Google Ads Accounts?
As of writing this post (March 1, 2016), we’ve audited 2,167 Google Ads accounts—representing over a $320 million in ad spend in hundreds of industries across the world.
All told, that ad spend paid for more than 90 billion impressions and well over 500 million clicks.
The question is, was it worth it?
Conversion Tracking
One of the first things you notice when you audit 2,000 Google Ads accounts is just how few accounts have effective conversion tracking in place.
To the credit of everyone who’s encouraged conversion tracking over the years, 57.7% of Google Ads accounts have set up some level of conversion tracking.
However, that means that 42.3% of Google Ads account managers have absolutely no idea whether or not their campaigns are working.
And, it gets worse.
Of that 58% of accounts with conversion tracking, only half—well, technically 50.1%—are actually tracking anything meaningful.
The other half is technically tracking conversions, but their setup is so poor that they might as well not be tracking anything at all.
![]()
For example, in the plumbing/HVAC industry, phone calls are a primary source of leads.
However, most plumbing/HVAC companies only track form submissions, which are few and far between—making them a terrible indicator of campaign effectiveness!
Plumbers aren’t the only ones with this problem, either. Many companies with millions of clicks have only a handful of conversions to their name.
Yes, they technically have conversion tracking in place, but it’s not doing them any good.
Conversion Rates
This poor tracking implementation heavily weights conversion rate estimates towards 0%. Even accounts with millions of clicks are not immune to this problem.
For example, take a look at this chart, which compares total clicks per Google Ads account to the conversion rate of the account.
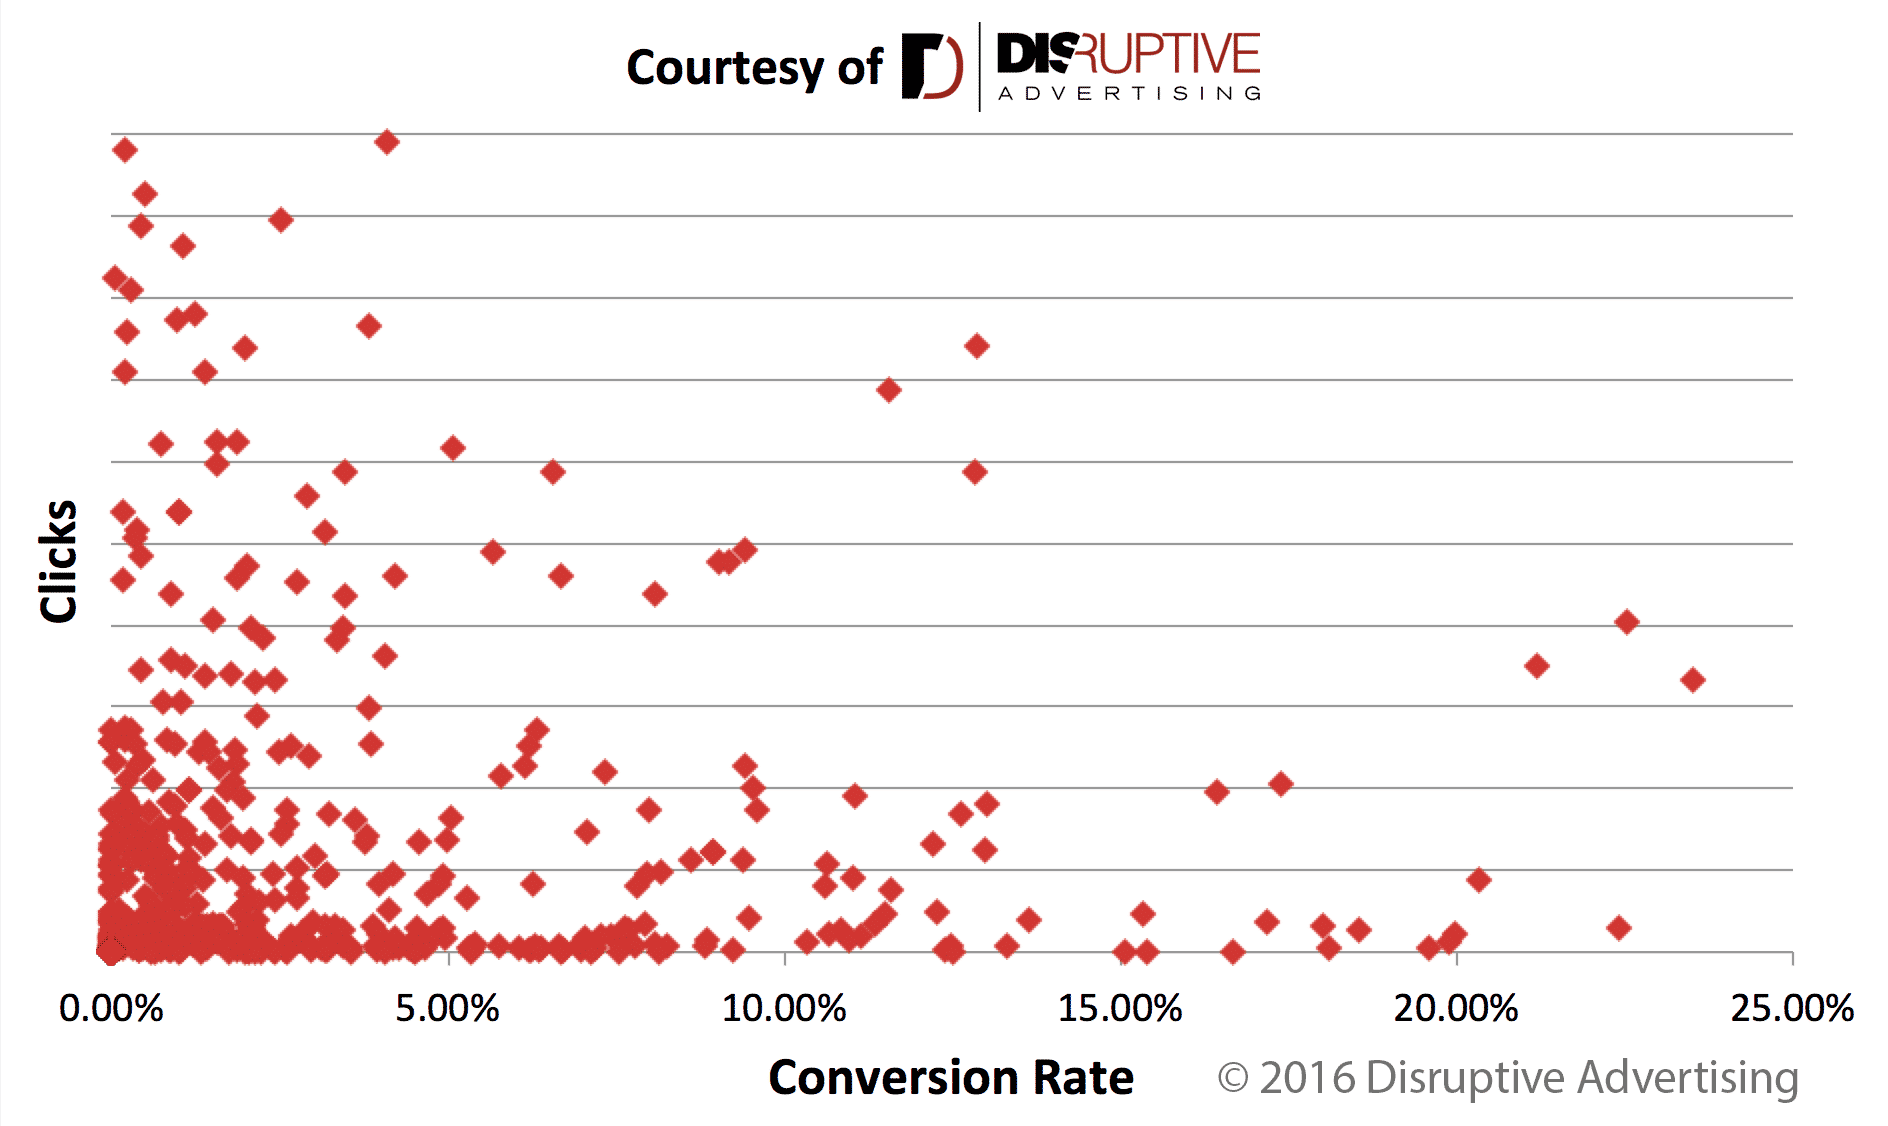
Clearly, there’s a reason why a conversion rate of 2-3% is generally considered “typical” for a Google Ads account.
Based on our data, the median conversion rate for an Google Ads account is 2.18%.
The bottom 27.5% of accounts lie in the 0-1% conversion rate range and the top 25% of accounts have a conversion rate better than 5.34% (note, this correlates well with Wordstream’s findings).
What does that mean for you? Well, if more than 5.34% of your clicks are converting, that means your conversion rate is better than 75% of Google Ads advertisers.
If your conversion rate is above 11.03%, your account is in the top 10% of all Google Ads accounts.
Great news, right?
Well, maybe.
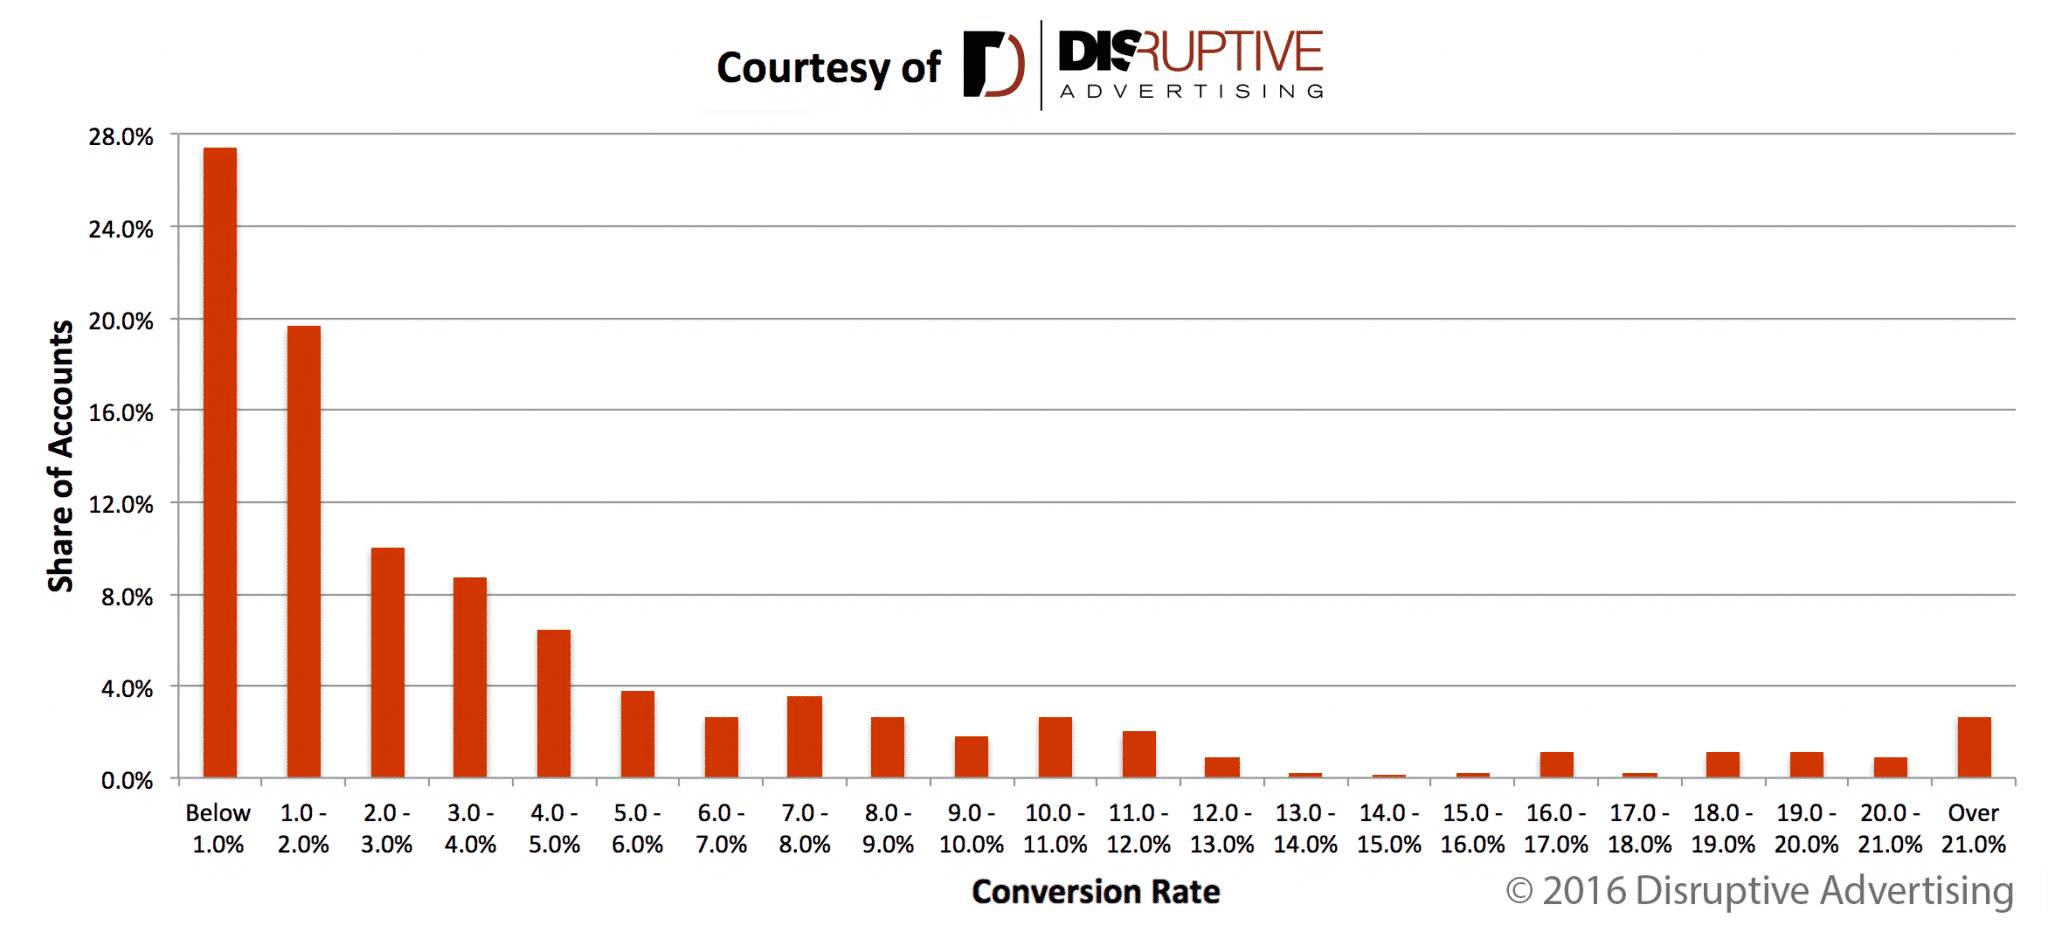
Remember, only half of conversion tracking is actually set up correctly. Here’s how the conversion rate distribution breaks down for the half with good conversion rate tracking in place:
![]()
For accounts with good conversion tracking, only 15.2% have a conversion rate of less than 1% (vs 27.5% for accounts with any sort of tracking).
On the other end of the spectrum, the top 10% of accurately tracked Google Ads accounts have a conversion rate of at least 20%!
As a result, the median conversion rate for these accounts is 3.16%—or about 50% higher than the average conversion rate for all tracked accounts.
So, if you want to improve your conversion rate by 50%, all you have to do is put solid tracking in place…

In all seriousness, though, most Google Ads accounts are missing at least half of their conversions, which makes it very difficult to do any effective campaign optimization.
Why? Let’s take a closer look at those well-tracked Google Ads accounts and see where most ad spend is really going.
Ad Spend Efficiency
Hopefully, it’s clear by now that most Google Ads accounts are not tracking their conversions properly. The question is, how does that affect campaign performance?
To get at that data, we need to look at overall budget efficiency.
Pay-per-click advertising is intent-based marketing. In other words, you want your ads to show up for internet searches that indicate a strong purchasing intent—you want to be seen by people who want your product or service.
Fortunately, Google Ads provides insight into the search intent of your audience through the Search Terms report.
The Search Term report allows you to see exactly what searches triggered your ad and how many impressions, clicks and conversions each search term produced.
If your campaigns are run well, your ads should show up when people are searching for what you have to offer. As a result, when they click on your ad, they should be taken to a landing page that meets their needs and convert.

However, if your ads are showing up for the wrong search terms (eg, the search intent is wrong), people might click on your ads, but they certainly won’t convert.
This makes the Search Terms report a key source of insight into the efficiency your ad spend.
The more money waste on search terms that don’t convert, the less effective your ad spend is. Conversely, a well-managed Google Ads budget will be primarily spent on search terms that produce conversions.
The question is, what percentage of ad spend actual goes towards search terms that convert?
Wasted Ad Spend
Obviously, you can only analyze ad spend efficiency with quality tracking, so the following results are pulled from those accounts with decent conversion tracking in place.
Across those accounts, 60.73% of their ad spend was spent on search terms that never converted.
In other words, 61% of ad spend is wasted.
Looking at the waste in individual accounts, wasted ad spend ranges from 6.58% to 99.70% as illustrated below:
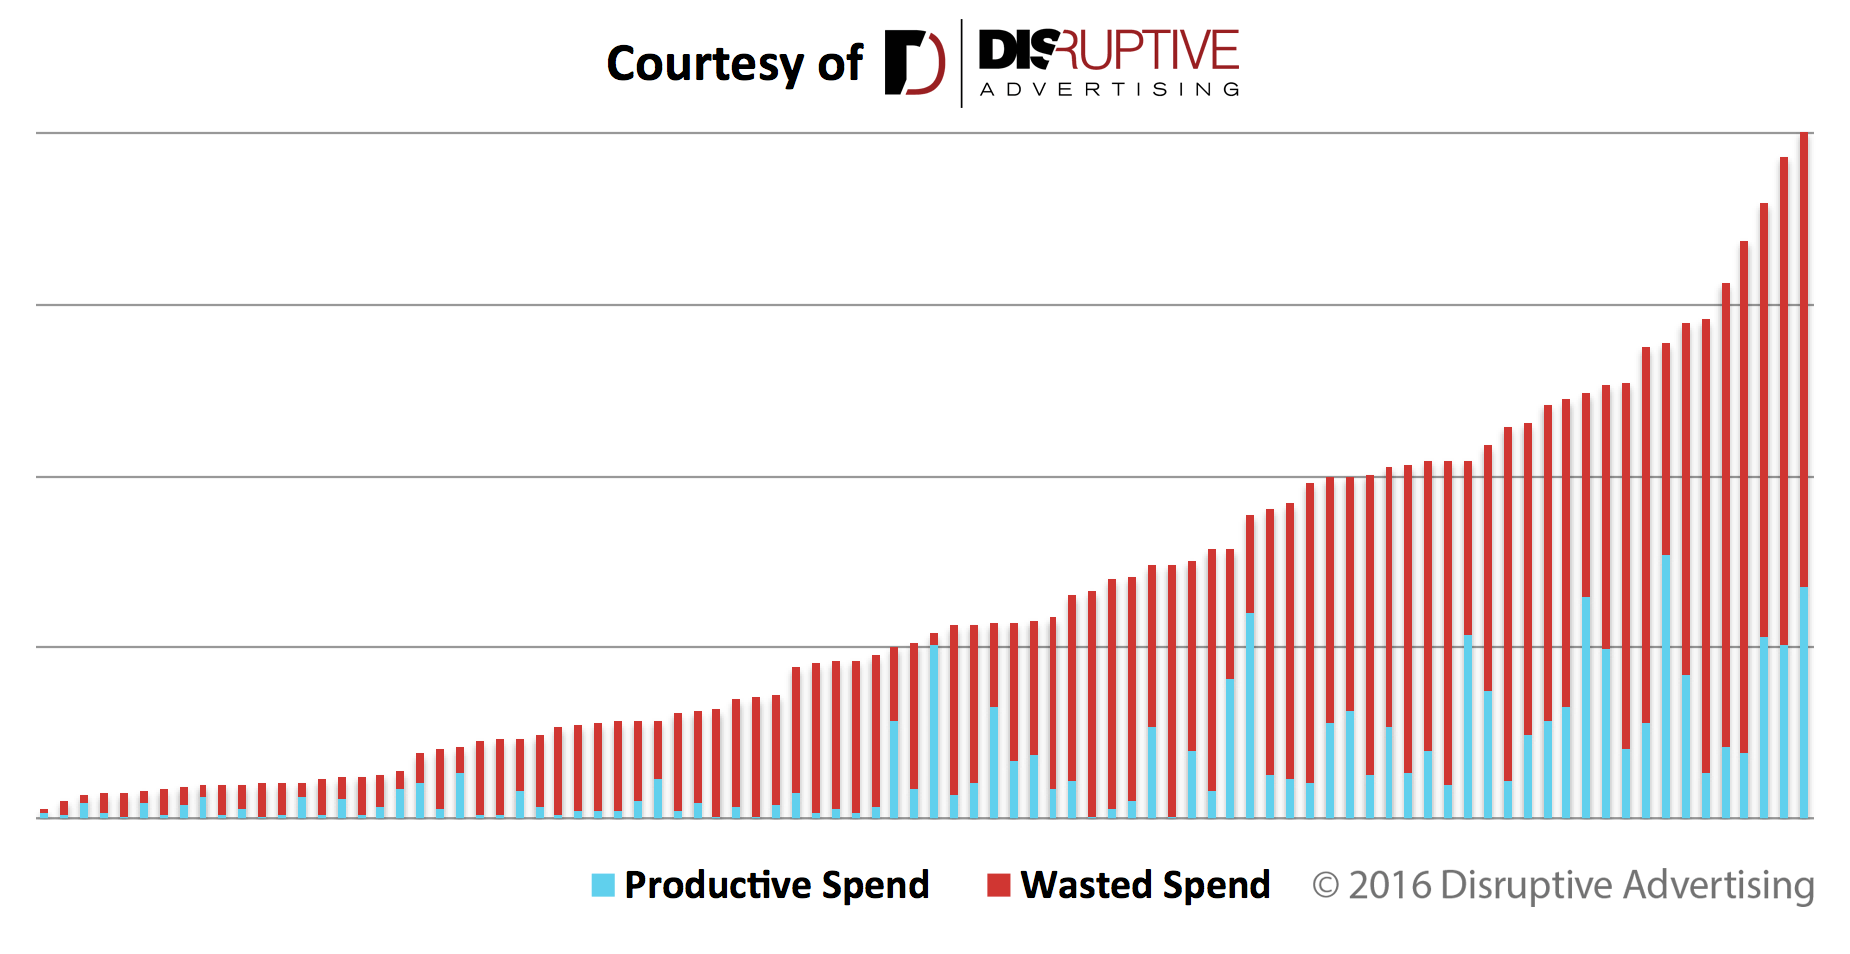
The median wasted ad spend for an individual account is 75.80%.
That means you are probably spending 76% of your Google Ads budget on searches that will never produce any value for your business.
And, if you aren’t tracking conversions properly, there’s not much you can do about it.
However, if you are tracking conversions, you can use this data to profoundly impact the performance of your Google Ads campaigns.
The Exponential Cost of Wasted Ad Spend
Not unsurprisingly, your cost-per-conversion is directly related to your wasted ad spend.
Unraveling this relationship is fairly complex, but I’ve already done the legwork for you, so you can just benefit from the results.
Now, you’d think the connection between wasted ad spend would be linear. In other words, for every 10% increase in wasted ad spend, your cost-per-conversion would increase by around 10%.
Let’s take a look.
Since cost-per-click has a significant effect on cost-per-conversion, let’s just evaluate Google Ads accounts with an effective cost-per-click of around $1.00:
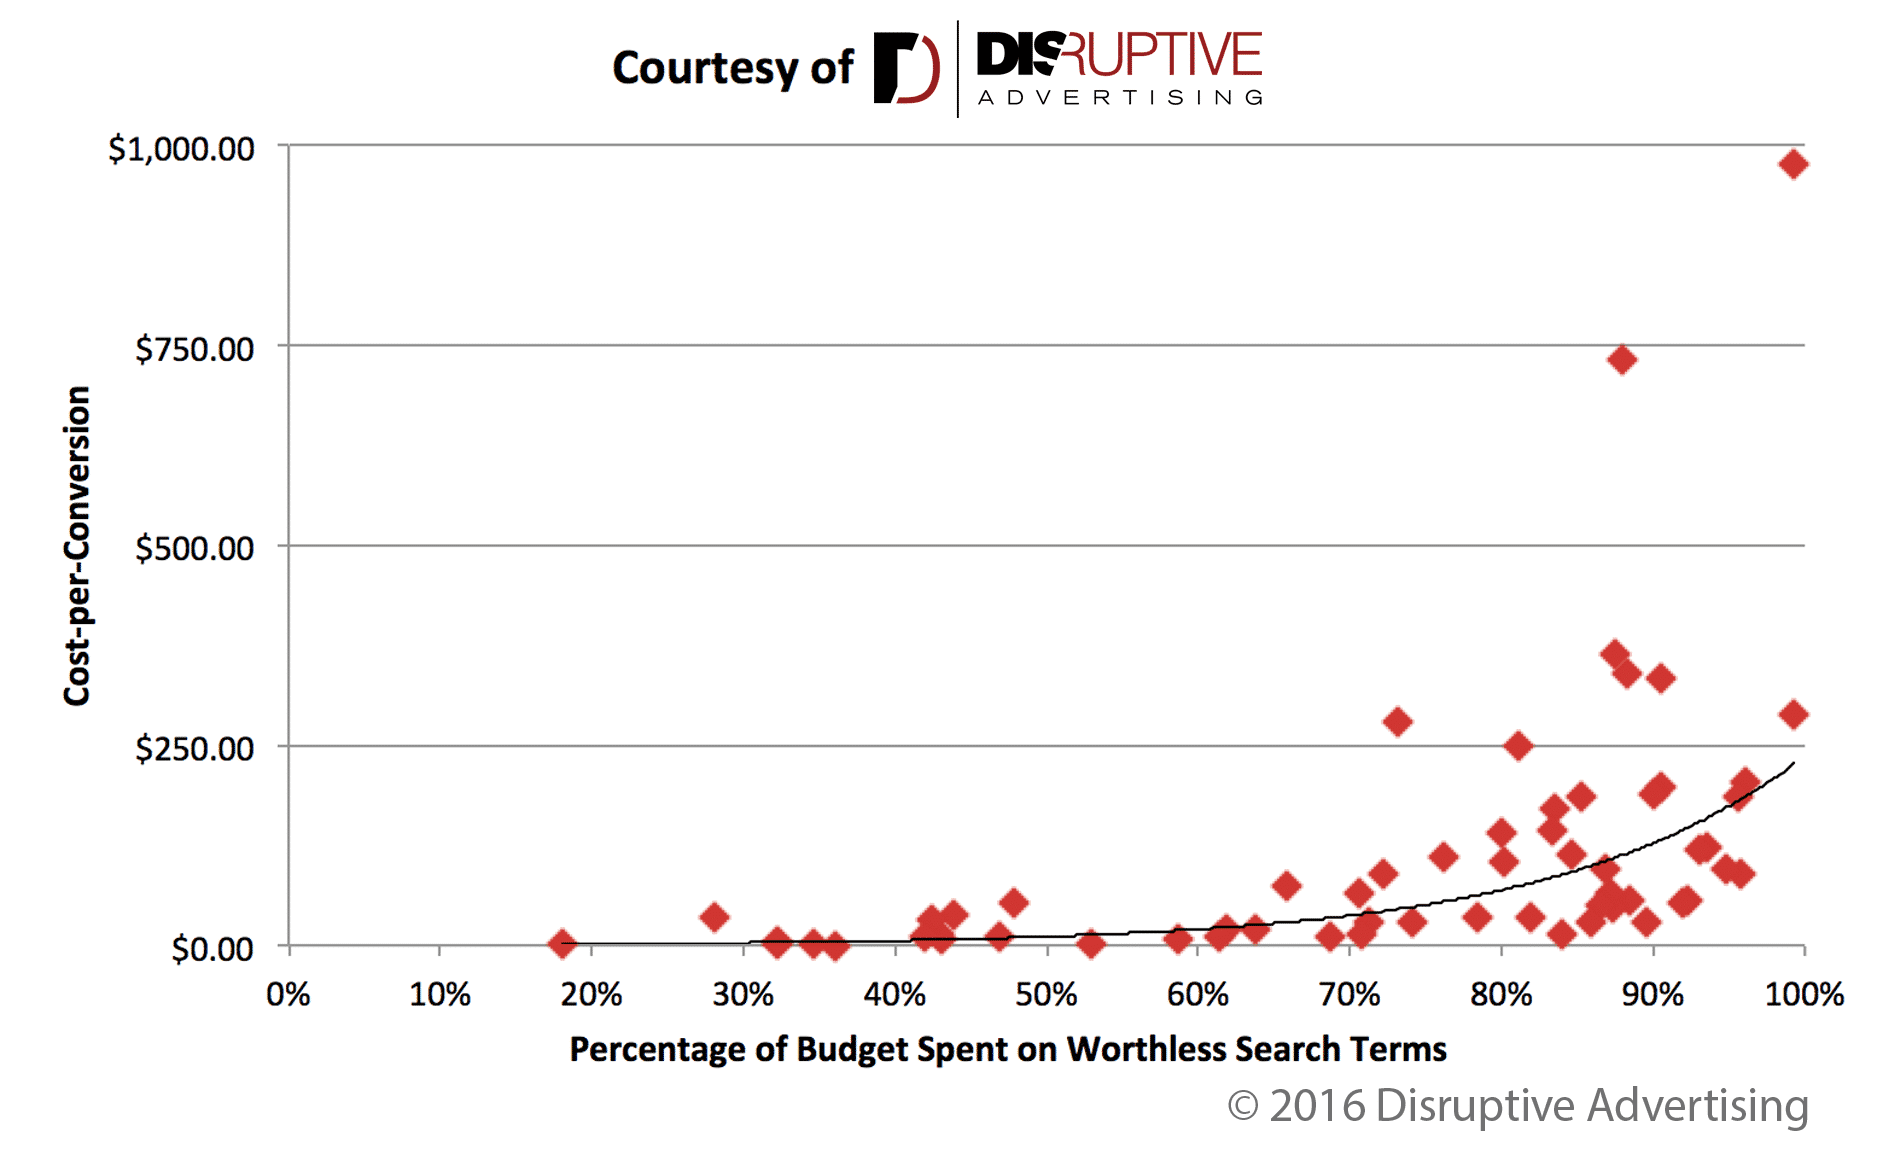
Yikes! The relationship isn’t linear…it’s exponential.
Cost-per-Conversion
As it turns out, for every 10% increase in wasted ad spend, your cost-per-conversion increases by 44-72%.
Every time.
So, if your cost-per-conversion is $10.00 and your wasted ad spend goes from 30% to 40%, your new cost-per-conversion will be somewhere around $14.43-17.22.
If it goes from 30% to say, 75.80%, your cost-per-conversion will jump to $53.79-120.20!
That’s an 540-1200% increase!

These results are consistent across a range of industries, conversion rates and average costs-per-click.
And, if you think about it, these results actually make a lot of sense. Every dollar you waste on non-converting search terms is a dollar you could have spent on keywords that convert.
That means your wasted ad spend has a lot of opportunity cost associated with it. You need your budget to buy clicks that convert.
If you waste it on something else, you dramatically reduce the effectiveness of your Google Ads account.
Wasted Ad Spend vs. Quality Score
Now, it’s important to note that this model only explains about 59.7% of the variation in the data (R2 = 0.597 after log-level regression). However, it is an accurate model of the data (ρ < 0.001).
As a result, the exact rate at which wasted ad spend increases your cost-per-conversion will vary from account to account while still following the trends outlined in this article.
By comparison, let’s take a look at quality score, which has been repeatedly touted as the most effective way to manage cost-per-conversion.
Using the cost-per-click matched accounts from our previous example, here’s how cost-per-conversion varies with impression-weighted quality score.
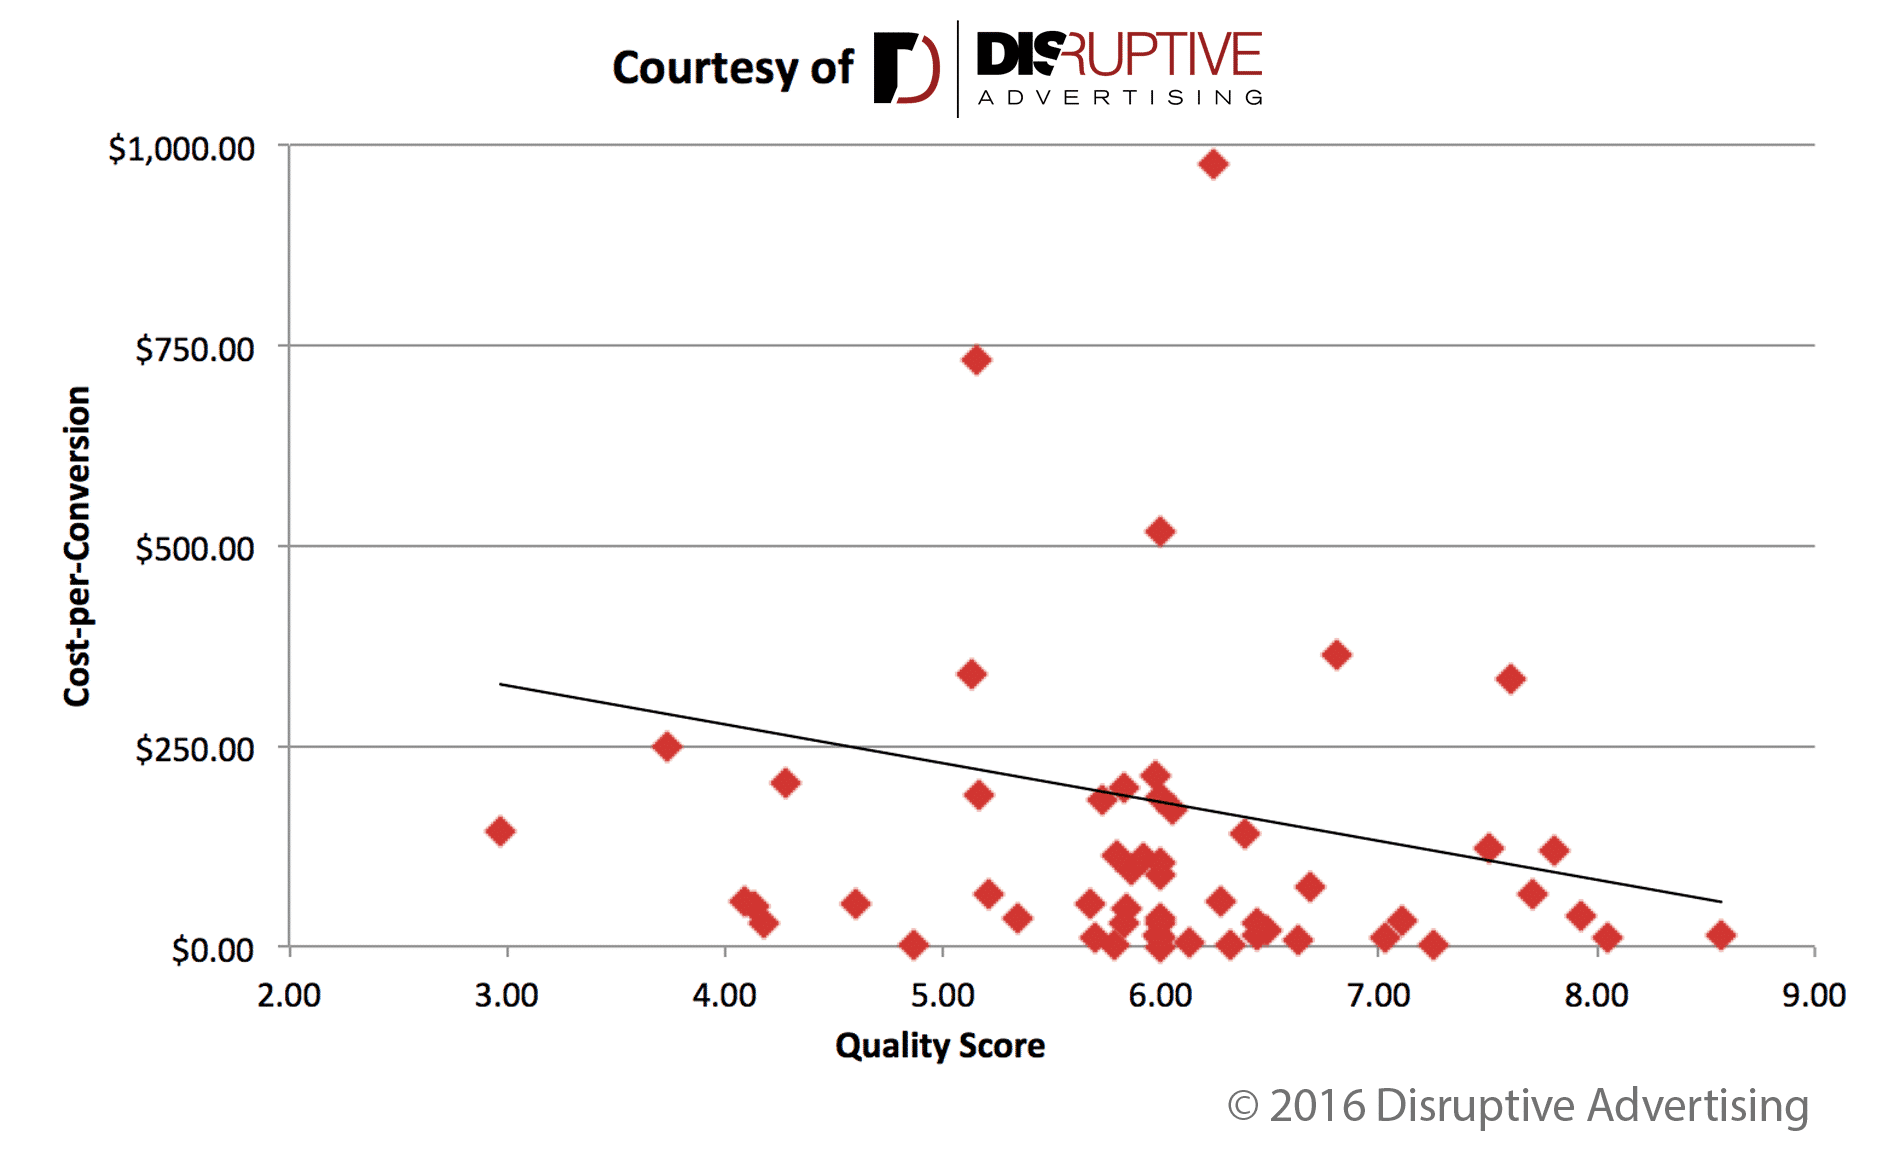
At first blush, it looks like a pretty direct correlation—as quality score increases, cost-per-conversion decreases.
In fact, our results are strikingly similar to those reported by Wordstream. Every 1-point increase in quality score reduces cost-per-conversion by 12.84%. Every 1-point decrease in quality score increases cost-per-conversion by 12.84%.
Or does it?
It turns out that a quality score-based model explains a mere 1.2% of the variability in the data (R2 = 0.012). To make matters worse, the data has a ρ-value of 0.46!
Statistically speaking, that’s a completely useless model.
And, it explains why improving your quality score often does little to improve your cost-per-conversion.
If you are wasting 75.8% of your ad spend to begin with, improving your quality score isn’t going to lower your cost-per-conversion by much.
However, if you’ve eliminated most of your wasted ad spend, a higher quality score will reduce your cost-per-click and—by extension—your cost-per-conversion.
What You Can Do With This Data
Fortunately, understanding how wasted ad spend affects the performance of your Google Ads account gives you a huge leg up on the competition.
First off, implementing and using quality tracking puts you ahead of 71% of the competition.
Second, you can use your conversion tracking data to identify where you are wasting your ad spend. Simply eliminating wasted ad spend will cut your cost-per-conversion and make your campaigns more profitable.
Third, and this is where the real power of your data comes into play, you can redirect that formerly-wasted ad spend towards effective keywords and search terms. Remember, that exponential acquisition cost equation works in reverse, too.
Shifting your budget from budget-sucking terms to profiting-producing keywords will allow you to produce many more leads at a substantially lower price.
In fact, this approach is so effective that it has become a key part of our Google Ads strategy at Disruptive. The results have redefined PPC advertising success for our clients.
By the way, if you’d like help putting our data to work for your business, let me know here or in the comments! I’d love to help.
What do you think of this data? Does it explain any observations you’ve made in your own Google Ads accounts? Any questions you’d like to ask? Leave your thoughts in the comments.


